Surface air temperature (SAT) anomalies have pronounced impacts on agriculture, socioeconomic development, and people’s daily lives. For example, the record-breaking hot summer over many parts of the Eurasia resulted in broad wildfires and large economic loss. Many studies have demonstrated that atmospheric circulation anomalies play an important role in modulating the SAT variations. Hence, the persistent characteristics of the Eurasian atmospheric circulation anomalies are crucial for the seasonal prediction of the Eurasian SAT. A question is whether the Eurasian atmospheric circulation anomalies can persist from winter to the following spring.
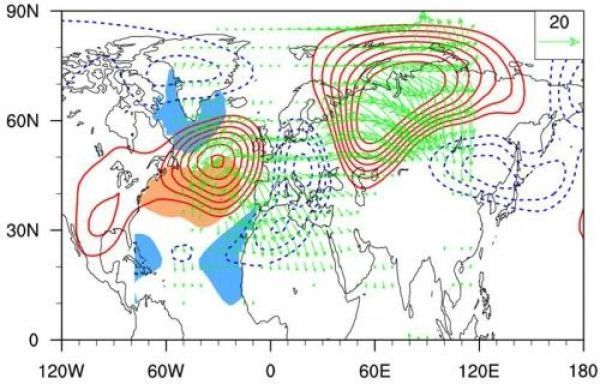
Using observational data and atmospheric model simulation, scientists from the Institute of Atmospheric Physics of the Chinese Academy of Sciences reported that the dominant mode of winter Eurasian 500-hPa geopotential height anomalies could maintain to the following spring. The maintenance of the dominant atmospheric circulation anomaly pattern is associated with a triple sea surface temperature (SST) anomaly pattern in the North Atlantic that is sustained from winter to the subsequent spring. This triple SST anomaly pattern triggers an atmospheric wave train over the North Atlantic through Eurasia during winter through spring. Atmospheric model experiments verify the role of the triple SST anomaly in maintaining the Eurasian atmospheric circulation anomalies.
However, Prof. WU Renguang, the corresponding author of a recent study published in Journal of Climate, found that the connection between the Eurasian winter and spring atmospheric circulation anomalies was only significant after the early-1990s.
Read more at Institute of Atmospheric Physics, Chinese Academy of Sciences
Image: Schematic diagram for the influence of the North Atlantic tripole sea surface temperature anomaly pattern on the Eurasian atmospheric circulation anomalies. The shadings in the North Atlantic represent sea surface temperature anomalies. Contours indicate 500hPa geopotential height anomalies. Vectors denote the wave activity flux. (Credit: Shangfeng Chen)


