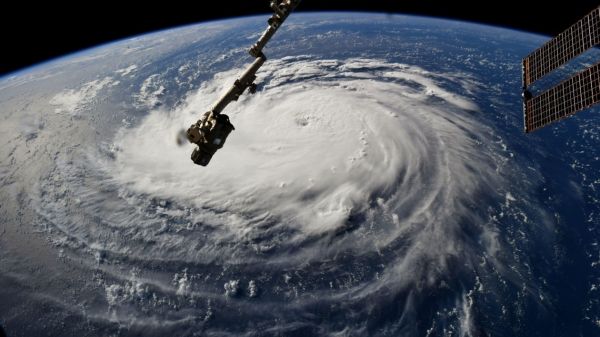
Modern meteorological data collection gives us an unprecedented view into the real-time growth, track, and death of tropical cyclones. Recently, we watched as Hurricane Florence started as a tropical wave off the west coast of Africa, grew into a storm with Category 4 winds, and then made landfall on September 14 near Wrightsville Beach, North Carolina. At that point, with sustained winds down to 90 miles-per-hour, Florence was classified as merely a Category 1 storm. But after moving rapidly across the Atlantic, Hurricane Florence had slowed to a crawl before hitting the Carolina coast, turning the storm into a rain bomb that dropped more precipitation — 36 inches in one town — than all previous U.S. tropical cyclones save one, last year’s Hurricane Harvey. Fears of coastal flooding were rapidly replaced by the reality of prolonged, inland flooding.
Hurricane Harvey, which devastated the Houston, Texas area in August 2017, came ashore as a Category 4 storm under the classic hurricane threat scale, which is based solely on wind speeds. But it was not wind damage or storm surge that made Harvey the second-most damaging hurricane in U.S. history (behind 2005’s Katrina) — it was the 60 inches of rain that fell for days in and around Houston, causing catastrophic flooding. As with Florence, Hurricane Harvey caused far more death and destruction from inland precipitation than from coastal storm surge and erosion.
And then there’s Hurricane Sandy, whose winds weren’t even strong enough to warrant classifying the storm as a hurricane when it made landfall in the U.S. mid-Atlantic states in 2012. Still, this massive storm generated significant storm surge — around 14 feet — that had dramatic coastal impacts, ripping barrier islands in half, causing significant oceanfront property damage, and bringing severe flooding to New York City.
Read more at Yale Environment 360
Image: Hurricane Florence as seen from the International Space Station on September 10. (Credit: NASA)


