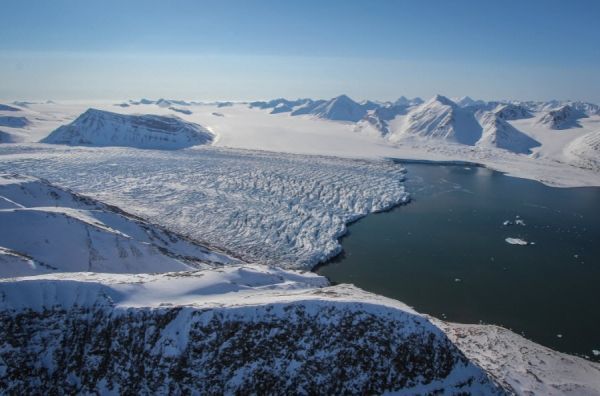
Global sea level is rising constantly. One factor contributing to this rise is the melting of the glaciers. However, although the surface area of the glaciers has been well mapped, there is often no information regarding their thickness, making it impossible to calculate their volume. As a result, we cannot accurately calculate the effects on sea levels. Dr. Johannes Fürst from the Institute of Geography at Friedrich-Alexander-Universität Erlangen-Nürnberg (FAU) has developed an approach which can be used to draw up regional ice thickness maps for glaciers. He has now produced such a map for Svalbard and published his findings in Geophysical Research Letters.
New ice thickness map, new findings
The FAU geographer Johannes Fürst has gathered and evaluated data measured by a number of international research teams since the early 1980s. These measurements have been entered into the new map of glacier thickness on Svalbard, an archipelago to the north of Norway with the main island Spitsbergen. Whereas previous studies have only looked at individual thickness measurements in isolation, projecting the total ice volume evolution on the basis of the surface area and just a few measurements, this map takes all available measurements into account in order to obtain a reliable estimate of the total ice volume. At 6,200 cubic kilometres, it is approximately one third smaller than previously presumed. Nevertheless, if this ice were to melt all of a sudden, it would still cause global sea levels to rise by 1.5 centimetres.
Read more at University of Erlangen–Nuremberg
Image Credit: Katrin Lindbäck, Norwegian Polar Institute


