A nautical chart is a map of the sea. Just as a map helps us navigate on land, a nautical chart helps those traveling on the ocean get where they’re going safely and efficiently.
In 2017, $1.6 trillion worth of goods moved through U.S. ports. With all that traffic, it’s important that those navigating through our ports and along our coastlines have the information they need about the shape of the shoreline and seafloor, water depths, potential hazards in the water, buoys, anchorages, and other features.
Federal laws say most commercial vessels must have nautical charts while traveling in U.S. waters. NOAA's Office of Coast Survey makes and updates all charts of U.S. coastal waters, the Great Lakes, and waters surrounding U.S. territories. So how do these important resources get made and updated? It’s a continuous process that involves many people from different disciplines and organizations.
t all starts with collecting the data. Historically, chart makers measured water depths with simple methods, like tying a lead weight to a line. Today, NOAA uses advanced technologies to study bodies of water and locate dangerous hazards to navigation, such as shoals or shipwrecks.
Continue reading at NOAA.
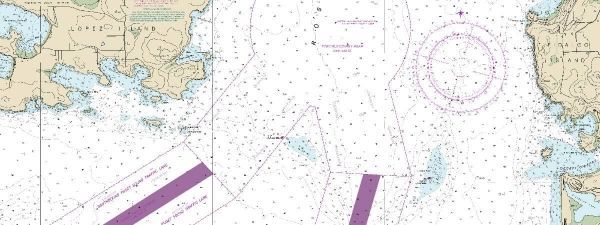
Image via NOAA.