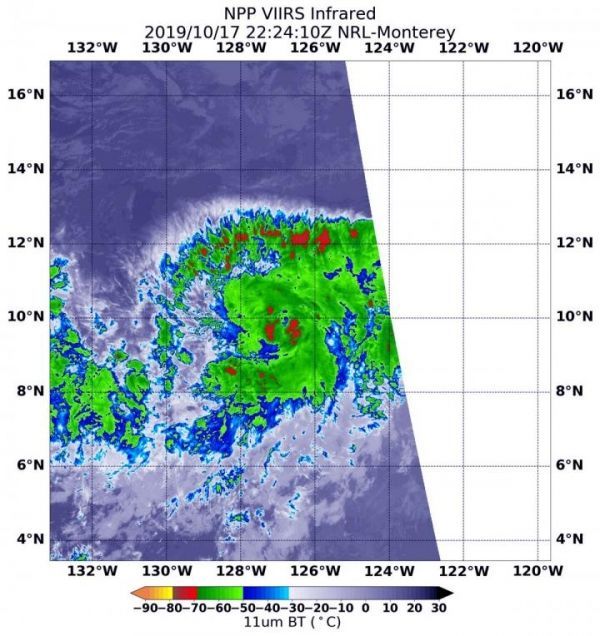
NASA-NOAA’s Suomi NPP satellite provided infrared data that showed the development of Tropical Storm Octave in the Eastern Pacific Ocean.
Octave formed on Oct. 17 by 5 p.m. EDT as a tropical depression. At that time, it was located about 1,410 miles (2,265 km) southwest of the southern tip of Baja California, Mexico.
The Visible Infrared Imaging Radiometer Suite (VIIRS) instrument aboard Suomi NPP provided an infrared image of the storm. The National Hurricane Center noted that, “The much improved cloud pattern consists of prominent convective curved bands in the east semicircle and recent bursts of deep convection.” Infrared imagery analyzes cloud top temperatures, and the higher the cloud top, the colder it is, and the stronger the storm. On Oct. 17 at 6:24 p.m. EDT (2224 UTC), a VIIRS image found several areas around the center of circulation where cloud top temperatures were as cold as minus 70 degrees Fahrenheit (minus 56.6 Celsius). Storms with cloud tops that cold have been found to generate heavy rainfall.
On Oct. 18, infrared data showed that cloud top temperatures had warmed, meaning they dropped in height. That drop in height indicates a weakening of the uplift of air and a weakening of the storm. NOAA’s National Hurricane Center or NHC said that at 5:41 a.m. EDT (0941 UTC), “Cloud tops have warmed during the past few hours, but the initial intensity is being held at 40 knots based on ASCAT [instrument] data from overnight.”
Read more at NASA/Goddard Space Flight Center
Image: NASA-NOAA's Suomi NPP satellite's VIIRS instrument aboard captured this infrared image of the Tropical Storm Octave as it developed on Oct. 17 at 6:24 p.m. EDT (2224 UTC). There were several areas (red) around the center of circulation where cloud top temperatures were as cold as minus 70 degrees Fahrenheit (minus 56.6 Celsius). (Credit: NASA/NRL)


