Data on emission amounts and sources have an important role to play in shaping policy on climate protection and air quality. Now, a team of researchers under the guidance of IASS Scientific Director Mark Lawrence has presented the first high-resolution inventory to record emissions of greenhouse gases and air pollutants in Nepal over an extended period of time. The researchers plan to use the data to develop further air quality strategies in Nepal.
“Over eighty percent of Nepal’s energy needs are met by biomass, in particular, wood. This gives rise to considerable amounts of particulate matter and ozone precursors, which adversely affect the climate, air quality, human health, crops and the cryosphere, those parts of the Earth’s surface where water is in solid form. The emissions inventory helps us identify the main causes of emissions, the proportional contributions of individual sources or sectors, and critical regions,” explains lead author Pankaj Sadavarte (currently at SRON Netherlands Institute for Space Research), who worked on the study as a postdoc at the IASS. The researchers estimated emissions from fuel consumption due to technology use in private households, industry, agriculture, the transport sector, and other economic sectors in the period from 2001 to 2016.
Wood-burning stoves a major source of air pollution
In Nepal, private households account for a much larger share of fuel consumption and hence emissions, especially particulates, than in industrial nations like Germany. For example, in 2011 they were responsible for 58 per cent of emissions of soot, one of the main components of particulate matter. The traditional low-efficiency wood-burning stoves used in most Nepalese homes for cooking and heating are the main culprits here. As well as being detrimental to human health, soot is an important climate forcer, the second largest after carbon dioxide. Carbon dioxide emissions in the same year came mainly from industries (46%), notably cement factories, followed by private households (31%), and transport (14%).
Read more at Institute for Advanced Sustainability Studies E.V. (IASS)
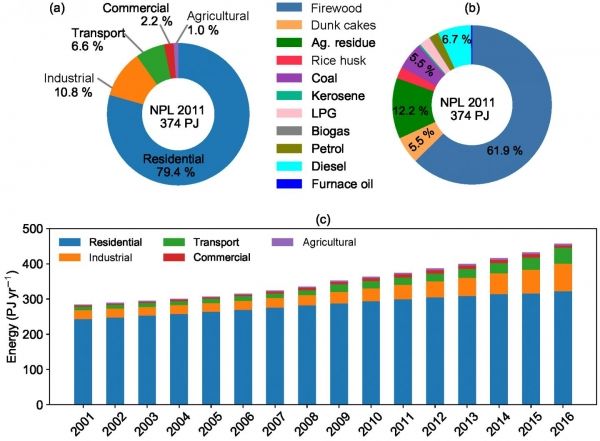
Image: (a) National sectoral energy consumption, (b) contribution of fuel type to national energy consumption estimated for 2011 and (c) energy consumption trend for the period 2001-2016. (Credit: © Authors 2019)