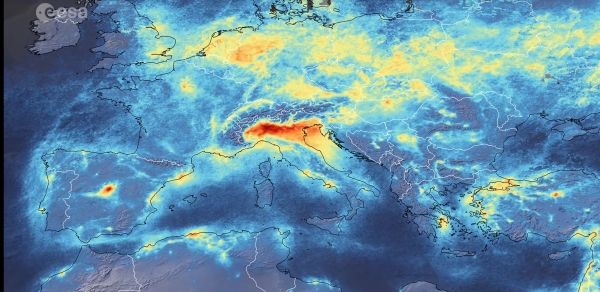
This reduction is particularly visible in northern Italy which coincides with its nationwide lockdown to prevent the spread of the coronavirus.
The animation shows the fluctuation of nitrogen dioxide emissions across Europe from 1 January 2020 until 11 March 2020, using a 10-day moving average. These data are thanks to the Tropomi instrument on board the Copernicus Sentinel-5P satellite which maps a multitude of air pollutants around the globe.
Claus Zehner, ESA’s Copernicus Sentinel-5P mission manager, comments, “The decline in nitrogen dioxide emissions over the Po Valley in northern Italy is particularly evident.
“Although there could be slight variations in the data due to cloud cover and changing weather, we are very confident that the reduction in emissions that we can see, coincides with the lockdown in Italy causing less traffic and industrial activities.”
Continue reading at European Space Agency
Image via European Space Agency


