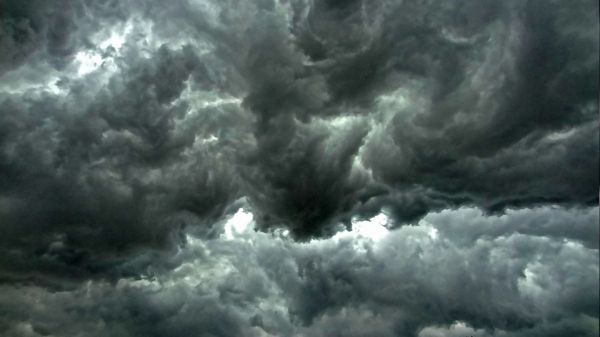
For two days in mid-April, severe storms raced through the southern U.S. and NASA created an animation using satellite data to show the movement and strength of those storms.
From Sunday, April 12 into Monday, April 13, 2020, a series of powerful thunderstorms developed across the southern U.S., bringing heavy rainfall and spawning several destructive tornadoes.
At NASA’s Goddard Space Flight Center in Greenbelt, Md. an animation was created that shows rainfall estimates for the region from April 11 to 13, derived from NASA's Integrated Multi-satellite Retrievals for GPM (IMERG) data product. The GPM or the Global Precipitation Measurement mission is a constellation of satellites provide the data for NASA’s IMERG. The animation showed several storms that dropped more than 0.6 inches/16 mm of rainfall per hour.
On April 12, two sets of storms with those rainfall rates almost blanketed the state of Arkansas and then moved into the Tennessee Valley. Storms also generated tornadoes as they moved through Alabama, Mississippi, northern Georgia, and the Carolinas. The tornadoes in the animation were confirmed with reports from the National Oceanic and Atmospheric Administration or NOAA.
Read more at NASA/Goddard Space Flight Center
Photo Credit: Jan-Mallander via Pixabay


