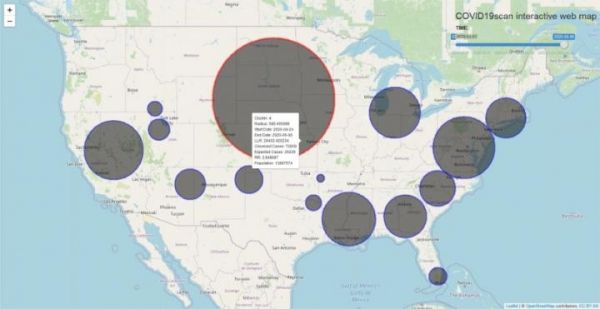
Over the course of the coronavirus epidemic, COVID-19 outbreaks have hit communities across the United States. As clusters of infection shift over time, local officials are forced into a whack-a-mole approach to allocating resources and enacting public health policies. In a new study led by the University of Utah, geographers published the first effort to conduct daily surveillance of emerging COVID-19 hotspots for every county in the contiguous U.S. The researchers hope that timely, localized data will help inform future decisions.
Using innovative space-time statistics, the researchers detected geographic areas where the population had an elevated risk of contracting the virus. They ran the analysis every day using daily COVID-19 case counts from Jan. 22 to June 5, 2020 to establish regional clusters, defined as a collection of disease cases closely grouped in time and space. For the first month, the clusters were very large, especially in the Midwest. Starting on April 25, the clusters become smaller and more numerous, a trend that persists until the end of the study.
The article published online on June 27, 2020, in the journal Spatial and Spatio-temporal Epidemiology. The study builds on the team’s previous work by evaluating the characteristics of each cluster and how the characteristics change as the pandemic unfolds.
“We applied a clustering method that identifies areas of concern, and also tracks characteristics of the clusters—are they growing or shrinking, what is the population density like, is relative risk increasing or not?” said Alexander Hohl, lead author and assistant professor at the Department of Geography at the U. “We hope this can offer insights into the best strategies for controlling the spread of COVID-19, and to potentially predict future hotspots.”
Read more at University of Utah
Image: The covid19scan web application screenshot taken on June 6, 2020. (Credit: Covid19scan web/Hohl)


