Following an unprecedented outburst of dry lightning in August 2020, wildfires ignited across the state of California. Raging for weeks to months amid heat waves and dry weather, the fires charred millions of acres and consumed homes, livelihoods, and lives. Now state and federal agencies are working to assess the damage.
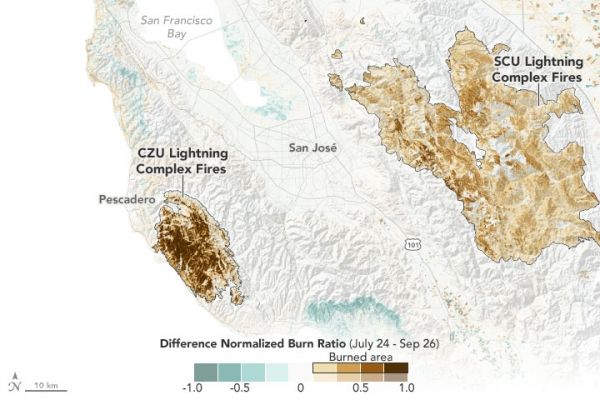
The map above uses Landsat 8 satellite data to provide some measure of the severity of the burns from the SCU and CZU Lightning Complex fires of August and September 2020. The technique, known as a normalized burn ratio, uses near-infrared and shortwave-infrared data collected on July 24 and September 26, 2020, to detect changes in the greenness of the landscape. The data were analyzed by remote sensing scientist Christopher Potter and colleagues at NASA’s Ames Research Center.
Shades of tan and brown reveal the severity of the burns from each fire, with the darkest shades revealing the greatest damage to the landscape. Areas colored dark brown have little to no live vegetation left; the landscape is mostly covered in soot, ash, and charred stumps and stems. Tan areas were significantly burned but still have some live vegetation. Beyond the fire burn scars, green and light brown areas likely indicate crop growth and harvesting or seasonal changes in trees and other vegetation.
Continue reading at NASA Earth Observatory
Image via NASA Earth Observatory