Could blending of crushed rock with arable soil lower global temperatures? / Researchers of Mainz University study global warming events from 40 and 56 million years ago to find answers.
The Earth is getting hotter and consequences have been made manifest this summer around the world. Looking back in geological history, global warming events are not uncommon: Around 56 million years ago, during the period known as the Paleocene–Eocene Thermal Maximum (PETM), the temperatures rose by an average of 5 to 8 degrees Celsius. This development was most likely linked to increased volcanism and the associated release of masses of carbon dioxide into the atmosphere. The higher temperatures persisted for about 200,000 years. Back in 2021, Professor Philip Pogge von Strandmann of Johannes Gutenberg University Mainz (JGU) had already investigated the effect that eventually led to global cooling and climatic recovery after the PETM warming. In short: Rainwater combined with the atmospheric carbon dioxide, resulting in carbonic acid that caused enhanced weathering of rock, thus releasing calcium and magnesium. Rivers then transported the calcium, magnesium, and carbonic acid into the oceans where the calcium, magnesium – and also the carbon dioxide – came together to form insoluble limestone. "In other words, there is a feedback effect that helps control the climate. High temperatures accelerate the chemical rock weathering process, reducing the levels of carbon dioxide in the atmosphere, allowing the climate to recover," said Pogge von Strandmann.
Climate Required Twice as Long to Regenerate 40 Million Years Ago
Climate warming occurred again 16 million years after the PETM during the Middle Eocene Climatic Optimum or MECO. Although volcanic activity resulted in the discharge of roughly the same amounts of carbon dioxide into the atmosphere as during the PETM, it took far longer for the climate to restabilize. The warming effect lasted for an immense 400,000 years, twice as long as in the PETM. Why was recovery so slow during that period?
Read more at Johannes Gutenberg University Mainz
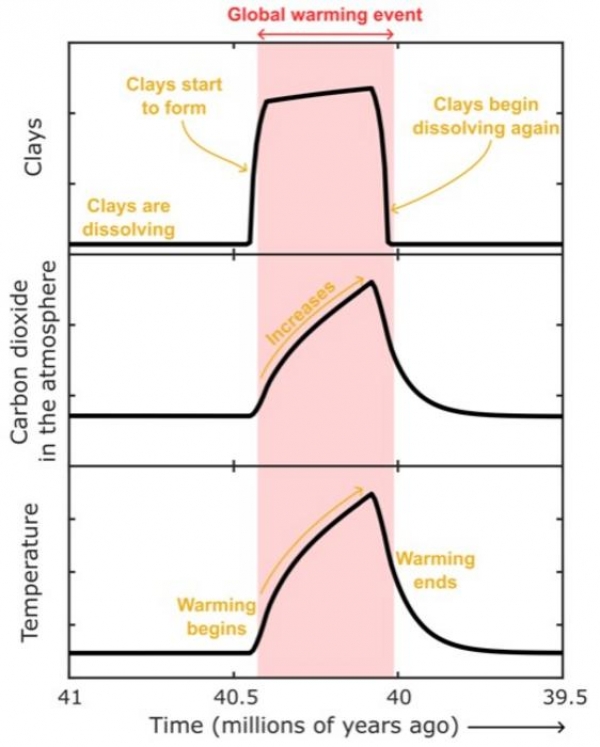
Image: The graphs illustrate changes to climate, carbon dioxide concentrations, and clay formation during the MECO. (Credit: ill./©: Alexander Krause)