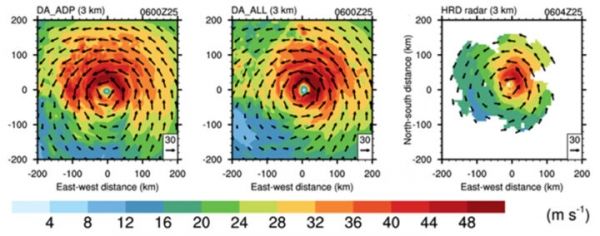
Much has happened in that time and the future looks very promising, with all eight microsatellites healthy and operating continuously in their nominal science data-taking mode. Year 1 was spent on engineering commissioning and initial ocean wind measurements. In year 2, the ocean wind retrievals were refined and characterized and investigations of observations over land began in earnest. This past year has seen progress on several fronts. An important refinement to the engineering calibration has been developed. Ocean wind measurements in tropical cyclones have been successfully introduced into numerical hurricane forecast models. And the ability to image inland waterbodies with high resolution has been leveraged to demonstrate two new measurement capabilities.
CYGNSS measures the strength of GPS signals reflected by the Earth surface, from which properties of the surface are derived. To do this accurately requires knowledge of the signal strength transmitted by the GPS satellite. The original approach to calibration assumed each GPS satellite had a unique transmit power level and that it did not vary in time. The unique power levels were estimated using measurements averaged over several months. Subsequent analysis has revealed that GPS transmit power can vary significantly, depending on the particular satellite and on its position in orbit. In order to compensate for the changes, the direct signal GPS receivers on all eight CYGNSS satellites were reprogrammed in 2018 to act as power meters which can monitor the variations in transmit power [Wang et al., 2019. A Real-Time EIRP Level 1 Calibration Algorithm for the CYGNSS Mission using the Zenith Measurements. Proc. IGARSS 2019]. The impact of this change is illustrated in the following figure. The top panel shows the geographical distribution of the average error in CYGNSS wind speed for a single GPS transmitter (SVN 63) assuming its transmit power is constant. The center panel shows the actual GPS transmit power as measured by the new on-board monitoring system. Clear localized differences in the measured power are evident which correlate with the errors in wind speed. The bottom panel shows the distribution of average wind speed error after the monitored power is incorporated into the calibration. The discrepancies have been largely removed.
Continue reading at NASA Earth Observatory
Image via NASA Earth Observatory


